If you don't know what cryptocoins are, go here!
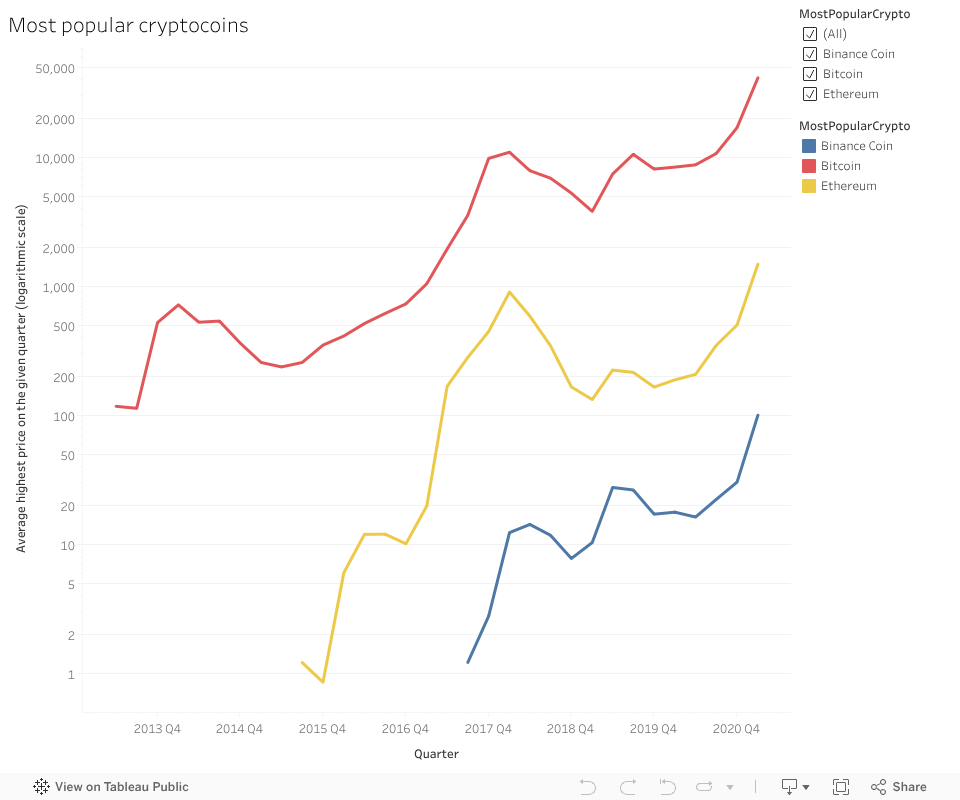
In this visualization project, we try to investigate the topic of cryptocurrencies and connect patterns in cryptocurrency price values to events in the news. For example, it is observed an increase in Bitcoin's price in November of 2013 after the announcement of the University of Nicosia accepting it as a payment method. Cryptocurrency has become a significant part of our life and of the global economy.
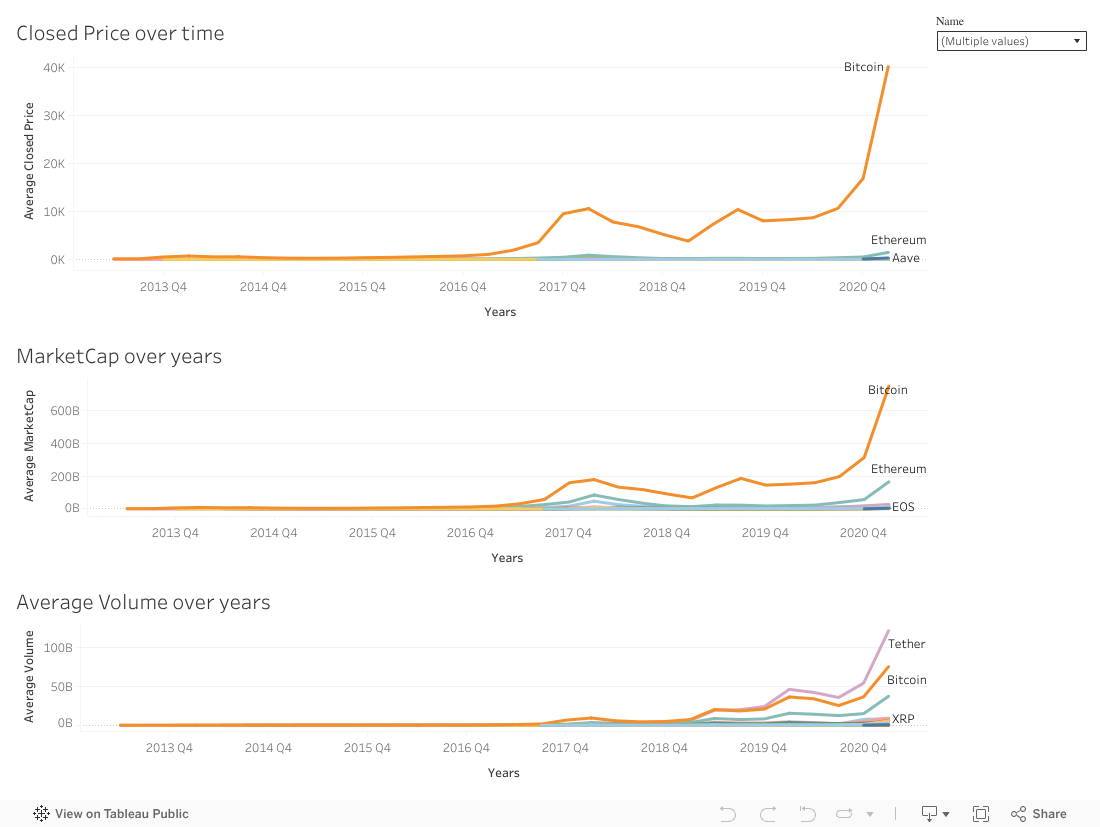
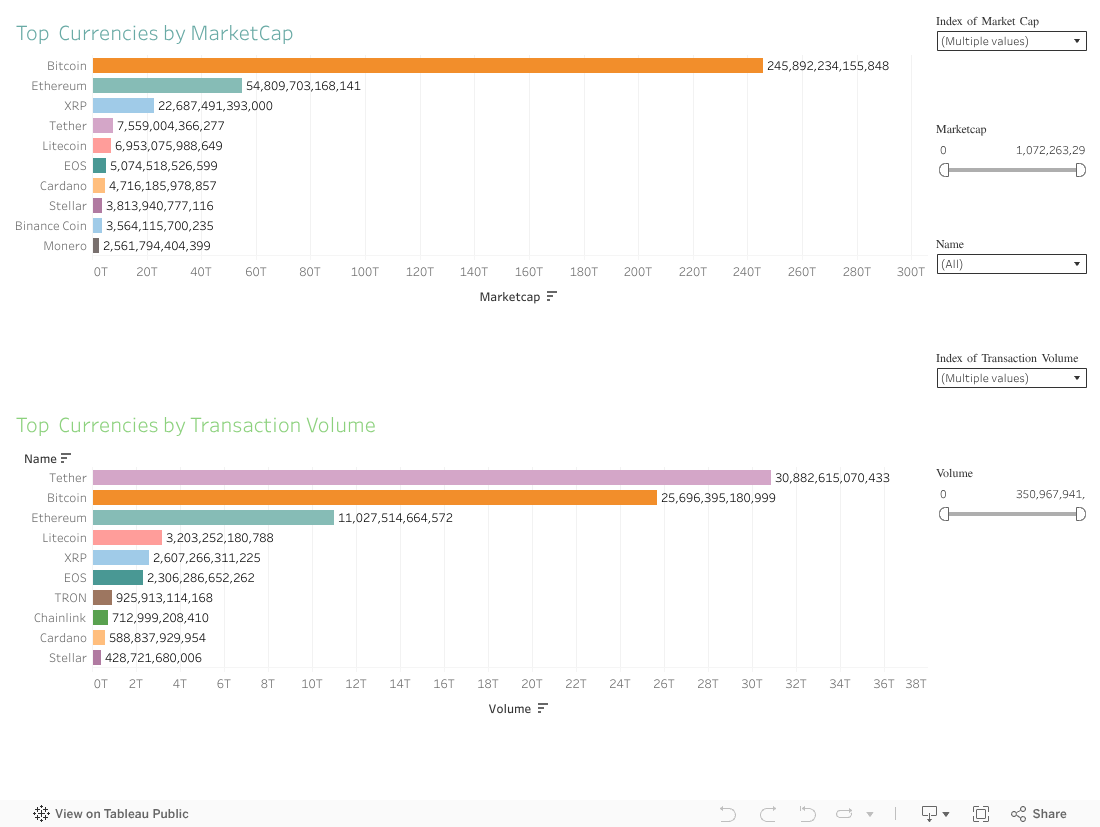
Moreover, the following dashboards give us important information about the evolution of cryptocurrencies through the years. To be more specific, we have line graphs that represent the progress of specific characteristics of cryptocurrencies over the years such as the highest price, closed price,marketcap(volume*price), average volume. Additionally, we show the top cryptocurrencies by marketcap and transaction volume.