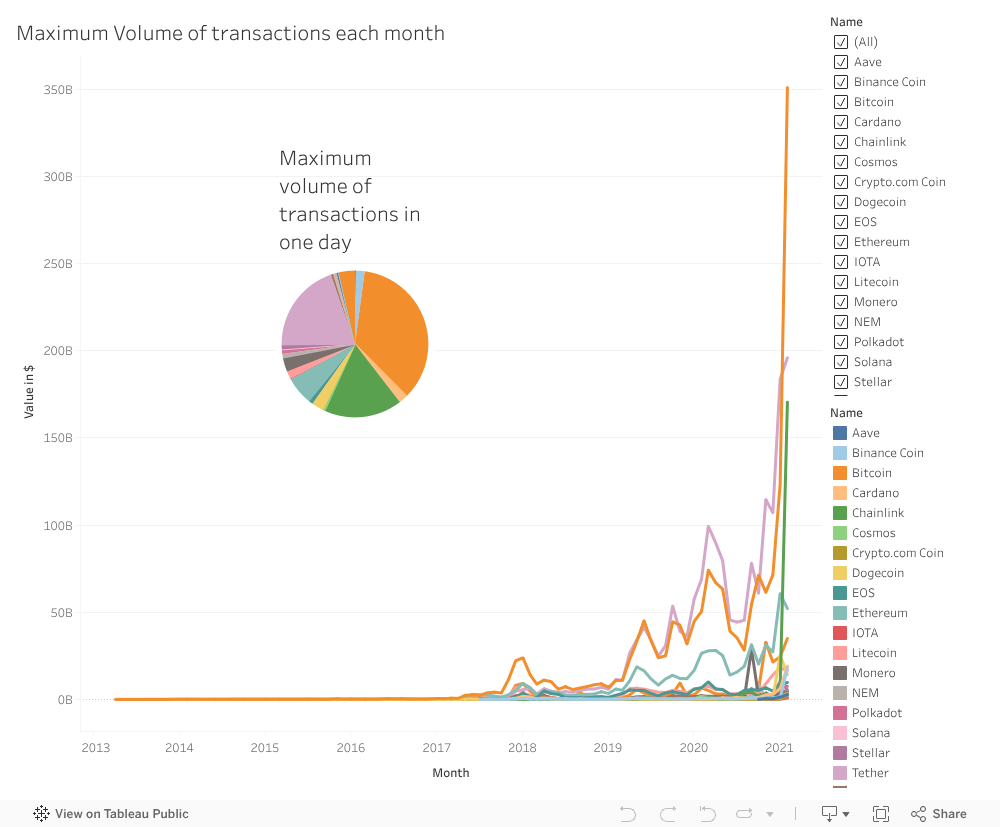
This line chart shows the maximum volume
of transactions on every month from April
2013 until February 2021.
The respective pie chart shows the maximum
volume on a given day in comparisson to the
other cryptocurrencies. It also provides the
total volume of transactions.